Automated traffic cameras have become a familiar part of the American roadway. They sit at intersections, school zones, and high‑speed corridors, capturing violations in seconds and issuing citations without an officer present. Their growth has sparked a national debate about safety, fairness, and the role of revenue in enforcement. A new analysis from Bader Law examines these systems across the United States, with a close look at Georgia, one of the most aggressive adopters of school zone speed cameras. The findings reveal a complex picture in which safety gains, public skepticism, and operational errors all play significant roles.
This rewritten report presents the data in a clear, digestible format, highlighting where automated enforcement succeeds and where it falls short.
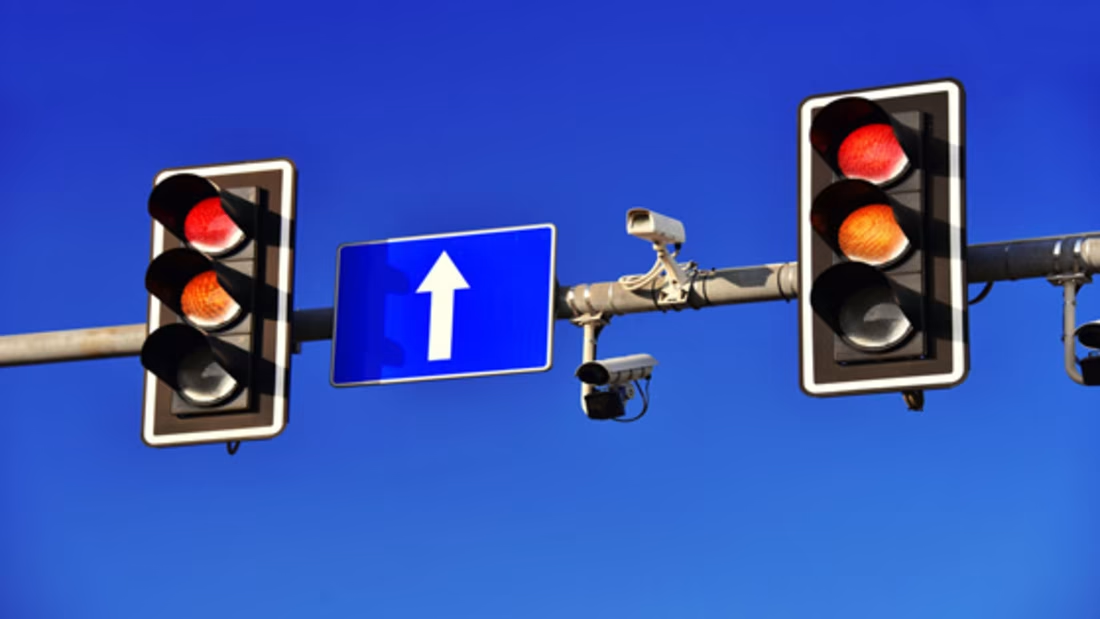
How Automated Enforcement Works
Red light and speed cameras were introduced to fill enforcement gaps in areas where police presence is limited. The systems rely on sensors and imaging technology to detect violations and record evidence for later review.
Speed Cameras
- Use radar or LIDAR to measure vehicle speed.
- Capture a license plate image when a driver exceeds the posted limit.
- Record time, date, and speed.
- Send the information to a sworn officer for review before a citation is issued.
Red Light Cameras
- Trigger when a vehicle enters an intersection after the signal turns red.
- Capture photos or video of the violation.
- Mail citations to the registered owner after officer review.
According to the Governors Highway Safety Association, these systems are most often placed in high‑risk areas such as school zones, major intersections, and corridors with a history of speed‑related crashes. While the process is designed to be efficient, concerns about accuracy, signage, and enforcement hours continue to shape public opinion.
Where Cameras Are Allowed or Banned
Automated enforcement laws vary widely across the country. As of 2026, the landscape remains divided.
State Allowances
- 19 states and Washington, D.C. permit speed cameras.
- 22 states and Washington, D.C. permit red light cameras.
State Bans
- 10 states prohibit speed cameras.
- 9 states prohibit red light cameras.
National Trend
Red light camera programs have declined over the past decade.
| Year | Number of Programs |
|---|---|
| 2012 | 533 |
| 2023 | 337 |
| 2026 | 352 |
Cities have ended programs due to legal challenges, revenue disputes, vendor costs, and public opposition. Court rulings in places like Albuquerque and St. Louis have shut down systems over due process concerns. Texas enacted statewide bans after complaints about limited opportunities to contest citations.
Public Opinion on Traffic Cameras
Surveys show that public support for automated enforcement is stronger than many assume, especially when safety is the primary goal.
Key Findings
- In a survey of 14 major U.S. cities with long‑running red light camera programs, two thirds of drivers supported the cameras in their own communities.
- In Washington, D.C., 87 percent of residents supported red light safety cameras.
However, support declines when enforcement feels unclear or unfair. Drivers express frustration when:
- Violations are borderline.
- Signage is poor or inconsistent.
- Tickets are issued outside posted enforcement hours.
These concerns shape the legitimacy of automated enforcement programs.
Safety Impact: What the Data Shows
Speeding and Fatal Crashes
Speeding remains a major contributor to roadway deaths in the United States. According to 2023 data from the National Highway Traffic Safety Administration:
- 11,775 people died in speeding‑related crashes.
- These deaths accounted for 29 percent of all traffic fatalities.
- 332,598 people were injured in speeding‑related crashes.
- Young drivers were heavily represented:
- 37 percent of male drivers aged 15 to 20 in fatal crashes were speeding.
- 18 percent of female drivers in the same age group were speeding.
Among speeding drivers involved in fatal crashes:
- 29 percent were unlicensed.
- 38 percent had a blood alcohol concentration of 0.08 percent or higher.
- 51 percent were unrestrained.
Notably, 88 percent of speeding‑related deaths occurred on non‑interstate roadways, where cameras are often placed.
Red Light Running
In 2023:
- 1,086 people were killed in red light running crashes.
- More than 135,000 people were injured.
Research shows that red light cameras reduce dangerous intersection crashes:
- Fatal red light crashes dropped 21 percent in large cities with cameras.
- Overall fatal crashes at signalized intersections dropped 14 percent.
- Right‑angle crashes fell 32 percent at camera‑equipped intersections.
When cameras were removed, fatal red light crashes increased. In 14 cities that discontinued programs between 2010 and 2014, fatal red light crashes were 30 percent higher than expected.
Before widespread camera use, violations were frequent. A 1999 study found that a motorist ran a red light every 20 minutes at each of five monitored intersections.
Tradeoffs and Engineering Considerations
Automated enforcement reduces severe crashes but can increase minor ones. A Federal Highway Administration study found:
| Crash Type | Change After Camera Installation |
|---|---|
| Right‑angle crashes | Decreased 25 percent |
| Rear‑end crashes | Increased 15 percent |
| Economic benefit | Exceeded $18.5 million across seven cities |
These findings suggest that cameras work best when paired with engineering improvements such as better signage, improved lighting, narrower lanes, or extended yellow signals.
Georgia: A Case Study in Rapid Expansion
Georgia has seen one of the fastest expansions of school zone speed cameras in the country.
Growth Since 2019
- Permits increased from 39 to 290.
- Cameras generated over $112 million in revenue.
- Revenue is typically split:
- 66 percent to the city and local school system.
- 34 percent to the vendor.
Communities Using Cameras
Alpharetta, Athens‑Clarke County, Clayton County, Duluth, Fulton County, Griffin, Gwinnett County, Marietta, Morrow, Riverdale, Savannah, and Tifton.
Enforcement Errors and Refunds
Georgia has faced significant accuracy issues:
- Jonesboro issued nearly 1,000 incorrect citations, refunding $76,400.
- Barrow County issued citations in a school zone where the sign was placed incorrectly, leading to $721,000 in refunds.
- By September 2025, 133,000 drivers were blocked from renewing registrations due to unpaid camera tickets, many disputed because school zone lights were not flashing.
Georgia law requires cameras to operate only when school zone signals are active, yet many citations were issued outside those hours.
Legislative Response
Rep. Dewey McClain has called for reform or removal of the system. He cites NHTSA data showing:
- Pedestrian fatalities rose from 262 in 2019 to 345 in 2022, a 31 percent increase.
- School‑age child fatalities remained mostly unchanged.
These trends challenge claims that school zone cameras have improved safety.
Broader Patterns and Policy Questions
Tourist Speed Traps
Georgia hosted 174 million visitors in 2025. Some towns have drawn national attention for aggressive enforcement:
- Warwick and Ashburn on I‑75 issued large numbers of tickets to out‑of‑state drivers.
- In Warwick, citation revenue exceeded $1,000 per resident.
- Tallulah Falls and Dillard generated significant portions of their budgets from traffic tickets.
Cost and Return on Investment
- Installation: $80,000 to $100,000 for a two‑camera intersection.
- Annual maintenance: $5,000 to $10,000.
- High‑volume systems may pay for themselves within 90 days.
A school zone camera in Marlborough, Connecticut issued 6,500 citations in six months, generating millions in fines.
Citation Productivity
| Location | Citations per Camera per Year |
|---|---|
| Washington, D.C. | ~9,655 |
| Chicago, IL | ~8,000 |
| Maryland counties | High productivity in school and work zones |
Alternative Approaches
Some cities prioritize engineering over enforcement:
- Detroit installed over 10,000 speed humps.
- Columbus and Fort Lauderdale use road design changes as part of Vision Zero strategies.
What the Data Shows Overall
Automated enforcement can reduce serious crashes, especially at intersections. However, the benefits depend on accuracy, transparency, and public trust.
Key Takeaways
- Errors in enforcement can lead to mass refunds and registration issues.
- Tourists and lower‑income drivers often bear the greatest burden.
- Revenue sharing creates concerns about financial incentives.
- In Georgia, pedestrian deaths have risen despite camera expansion.
Automated enforcement works best when paired with clear rules, strong oversight, and infrastructure improvements. The data suggests that cameras can improve safety, but only when implemented responsibly and transparently.